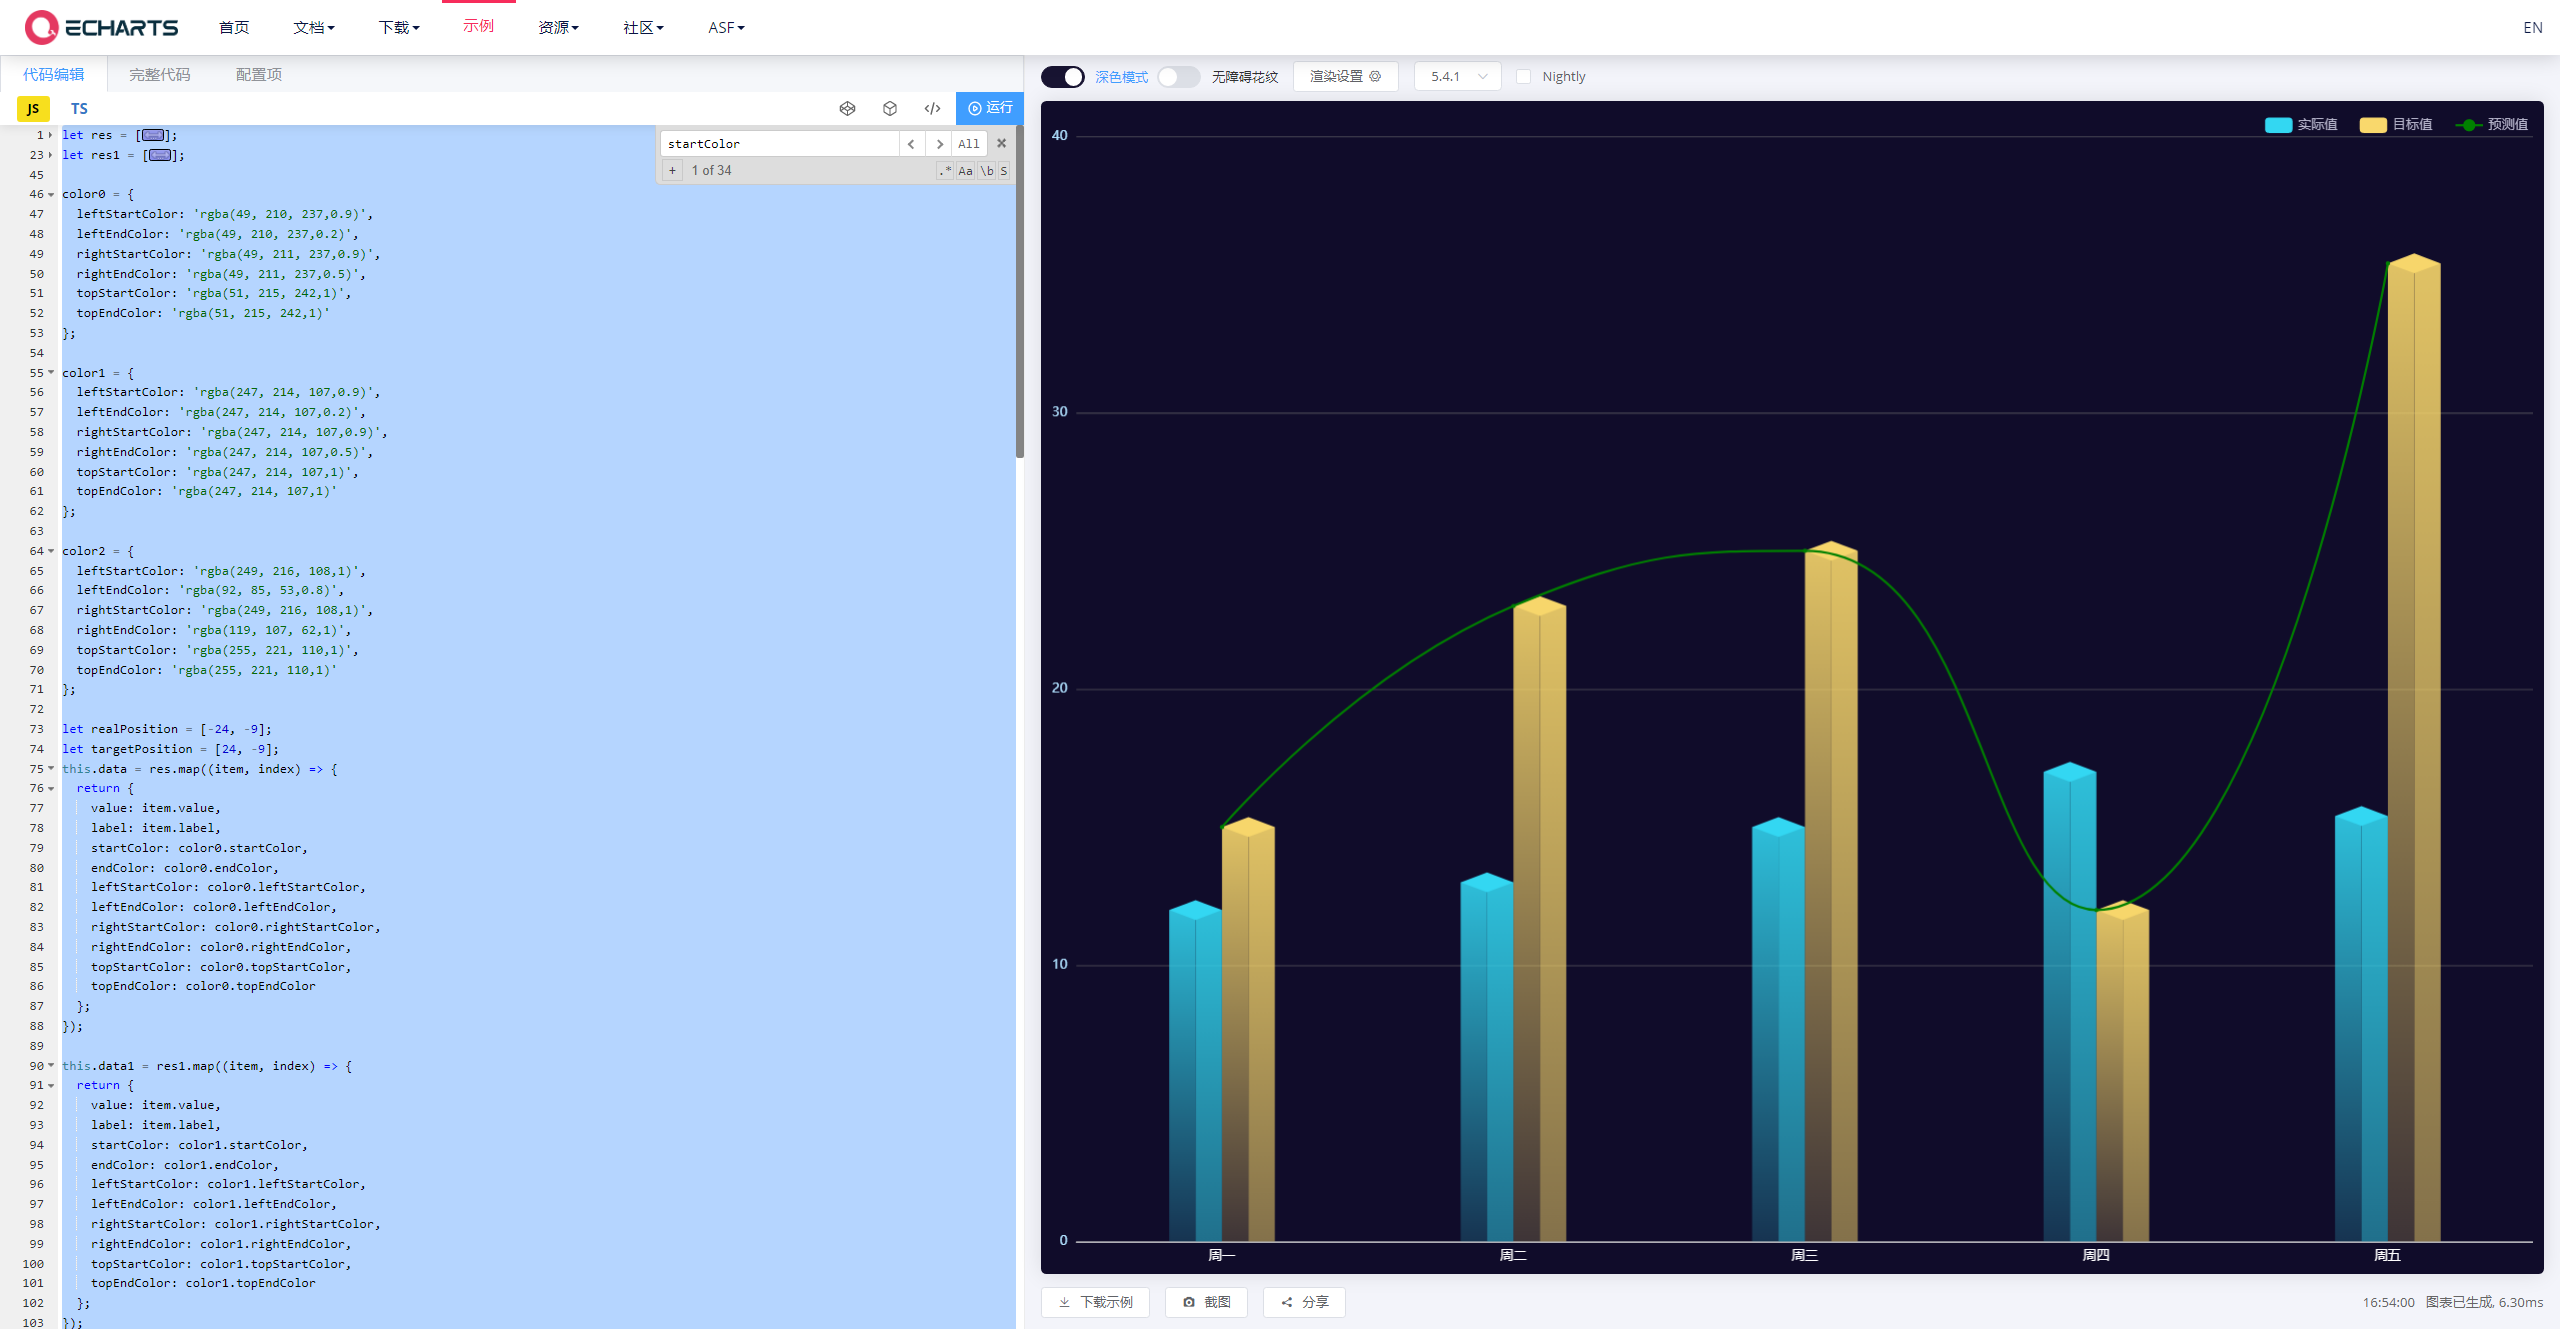
2023-3-10 16:57:07 新的,用这个

let res = [
  {
    label: '周一',
    value: 12
  },
  {
    label: '周二',
    value: 13
  },
  {
    label: '周三',
    value: 15
  },
  {
    label: '周四',
    value: 17
  },
  {
    label: '周五',
    value: 15.4
  }
];
let res1 = [
  {
    label: '周一',
    value: 15
  },
  {
    label: '周二',
    value: 23
  },
  {
    label: '周三',
    value: 25
  },
  {
    label: '周四',
    value: 12
  },
  {
    label: '周五',
    value: 35.4
  }
];

color0 = {
  leftStartColor: 'rgba(49, 210, 237,0.9)',
  leftEndColor: 'rgba(49, 210, 237,0.2)',
  rightStartColor: 'rgba(49, 211, 237,0.9)',
  rightEndColor: 'rgba(49, 211, 237,0.5)',
  topStartColor: 'rgba(51, 215, 242,1)',
  topEndColor: 'rgba(51, 215, 242,1)'
};

color1 = {
  leftStartColor: 'rgba(247, 214, 107,0.9)',
  leftEndColor: 'rgba(247, 214, 107,0.2)',
  rightStartColor: 'rgba(247, 214, 107,0.9)',
  rightEndColor: 'rgba(247, 214, 107,0.5)',
  topStartColor: 'rgba(247, 214, 107,1)',
  topEndColor: 'rgba(247, 214, 107,1)'
};

color2 = {
  leftStartColor: 'rgba(249, 216, 108,1)',
  leftEndColor: 'rgba(92, 85, 53,0.8)',
  rightStartColor: 'rgba(249, 216, 108,1)',
  rightEndColor: 'rgba(119, 107, 62,1)',
  topStartColor: 'rgba(255, 221, 110,1)',
  topEndColor: 'rgba(255, 221, 110,1)'
};

let realPosition = [-24, -9];
let targetPosition = [24, -9];
this.data = res.map((item, index) => {
  return {
    value: item.value,
    label: item.label,
    startColor: color0.startColor,
    endColor: color0.endColor,
    leftStartColor: color0.leftStartColor,
    leftEndColor: color0.leftEndColor,
    rightStartColor: color0.rightStartColor,
    rightEndColor: color0.rightEndColor,
    topStartColor: color0.topStartColor,
    topEndColor: color0.topEndColor
  };
});

this.data1 = res1.map((item, index) => {
  return {
    value: item.value,
    label: item.label,
    startColor: color1.startColor,
    endColor: color1.endColor,
    leftStartColor: color1.leftStartColor,
    leftEndColor: color1.leftEndColor,
    rightStartColor: color1.rightStartColor,
    rightEndColor: color1.rightEndColor,
    topStartColor: color1.topStartColor,
    topEndColor: color1.topEndColor
  };
});
option = {
  color: ['rgb(51,215,242)', 'rgba(249, 216, 108,1)', '#f00'],
  tooltip: {
    trigger: 'axis',
    formatter: (tipArr) => {
      let arr = tipArr.map((item) => {
        return {
          type: item.seriesName,
          value: item.value,
          marker: item.marker
        };
      });

      let map = new Map();
      for (let item of arr) {
        map.set(item.type, item);
      }
      let str = '';
      [...map.values()].forEach((i) => {
        str += `${i.marker}${i.type}:${i.value} <br/>`;
      });
      return str;
    }
  },
  legend: {
    x:'right',
    data: ['实际值', '目标值', '预测值'],
     itemGap: 20
  },
  xAxis: {
    type: 'category',
    data: this.data.map((i) => i.label),
    // x坐标轴为虚线
    axisLine: {
      lineStyle: {
        color: '#fff',
        opacity: 0.8
      }
    },
    // 不展示下面|
    axisTick: {
      show: false
    },
    axisLabel: {
      show: true,
      color: '#ffffff',
      fontSize: 12 // 字体大小
    }
  },
  yAxis: {
    type: 'value',
    // 不展示刻度线
    splitLine: {
      show: true
    },
    axisLabel: {
      show: true,
      color: '#B0E1FF',
      fontSize: 12 // 字体大小
    }
  },
  // 栅格
  grid: {
    left: '0',
    right: '0',
    bottom: '0%',
    top: '22px',
    containLabel: true
  },
  series: [
    // 数据的柱状图
    {
      name: '实际值',
      type: 'bar',
      barWidth: 24, // 柱条的宽度,不设时自适应。
      data: this.data,
      itemStyle: {
        color: (params) => {
          return new echarts.graphic.LinearGradient(0, 0, 0, 1, [
            { offset: 0, color: params.data.leftStartColor },
            { offset: 1, color: params.data.leftEndColor }
          ]);
        }
      }
    },
    {
      name: '实际值',
      type: 'bar',
      barWidth: 24, // 柱条的宽度,不设时自适应。
      barGap: 0, // 不同系列的柱间距离
      data: this.data,
      itemStyle: {
        normal: {
          color: (params) => {
            return new echarts.graphic.LinearGradient(0, 0, 0, 1, [
              { offset: 0, color: params.data.rightStartColor },
              { offset: 1, color: params.data.rightEndColor }
            ]);
          },
          borderWidth: 0.1,
          borderColor: 'transparent'
        }
      }
    },
    // 新的一条数据
    {
      name: '目标值',
      type: 'bar',
      barWidth: 24, // 柱条的宽度,不设时自适应。
      data: this.data1,
      barGap: 0,
      itemStyle: {
        color: (params) => {
          return new echarts.graphic.LinearGradient(0, 0, 0, 1, [
            { offset: 0, color: params.data.leftStartColor },
            { offset: 1, color: params.data.leftEndColor }
          ]);
        }
      }
    },
    {
      name: '目标值',
      type: 'bar',
      barWidth: 24, // 柱条的宽度,不设时自适应。
      barGap: 0, // 不同系列的柱间距离
      data: this.data1,
      itemStyle: {
        normal: {
          color: (params) => {
            return new echarts.graphic.LinearGradient(0, 0, 0, 1, [
              { offset: 0, color: params.data.rightStartColor },
              { offset: 1, color: params.data.rightEndColor }
            ]);
          },
          borderWidth: 0.1,
          borderColor: 'transparent'
        }
      }
    },
    // 数据顶部的样式
 // 数据顶部的样式
    {
      name: '实际值',
      type: 'pictorialBar',
      symbol: 'diamond',
      symbolSize: [48, 18],
      symbolOffset: realPosition, // [0, -9]
      symbolPosition: 'end',
      z: 3,
      itemStyle: {
        normal: {
          color: (params) => {
            return new echarts.graphic.LinearGradient(0, 0, 0, 1, [
              { offset: 0, color: params.data.topStartColor },
              { offset: 1, color: params.data.topEndColor }
            ]);
          }
        }
      },
      data: this.data
    },
    {
      name: '目标值',
      type: 'pictorialBar',
      symbol: 'diamond',
      symbolSize: [48, 18],
      symbolOffset: targetPosition, // [0,-9]
      symbolPosition: 'end',
      z: 3,
      itemStyle: {
        normal: {
          color: (params) => {
            return new echarts.graphic.LinearGradient(0, 0, 0, 1, [
              { offset: 0, color: params.data.topStartColor },
              { offset: 1, color: params.data.topEndColor }
            ]);
          }
        }
      },
      data: this.data1
    },
    {
      name: '预测值',
      smooth: true,
      type: 'line',
      data: this.data1,
      itemStyle: {
        normal: {
          color: 'green',
          borderWidth: 0.1,
          borderColor: 'transparent'
        }
      }
    }
  ]
};

myChart.off('legendselectchanged').on('legendselectchanged', function (params) {
  var option = this.getOption();

  if (params.selected.实际值 === true && params.selected.目标值 === false) {
    targetPosition = [24, -9];
    realPosition = [-0, -9];
  }

  if (params.selected.实际值 === false && params.selected.目标值 === true) {
    targetPosition = [0, -9];
    realPosition = [-24, -9];
  }

  if (params.selected.实际值 === true && params.selected.目标值 === true) {
    targetPosition = [24, -9];
    realPosition = [-24, -9];
  }

  option.series[2].symbolOffset = realPosition;
  option.series[5].symbolOffset = targetPosition;

  myChart.setOption(option, true);
  // do something
});
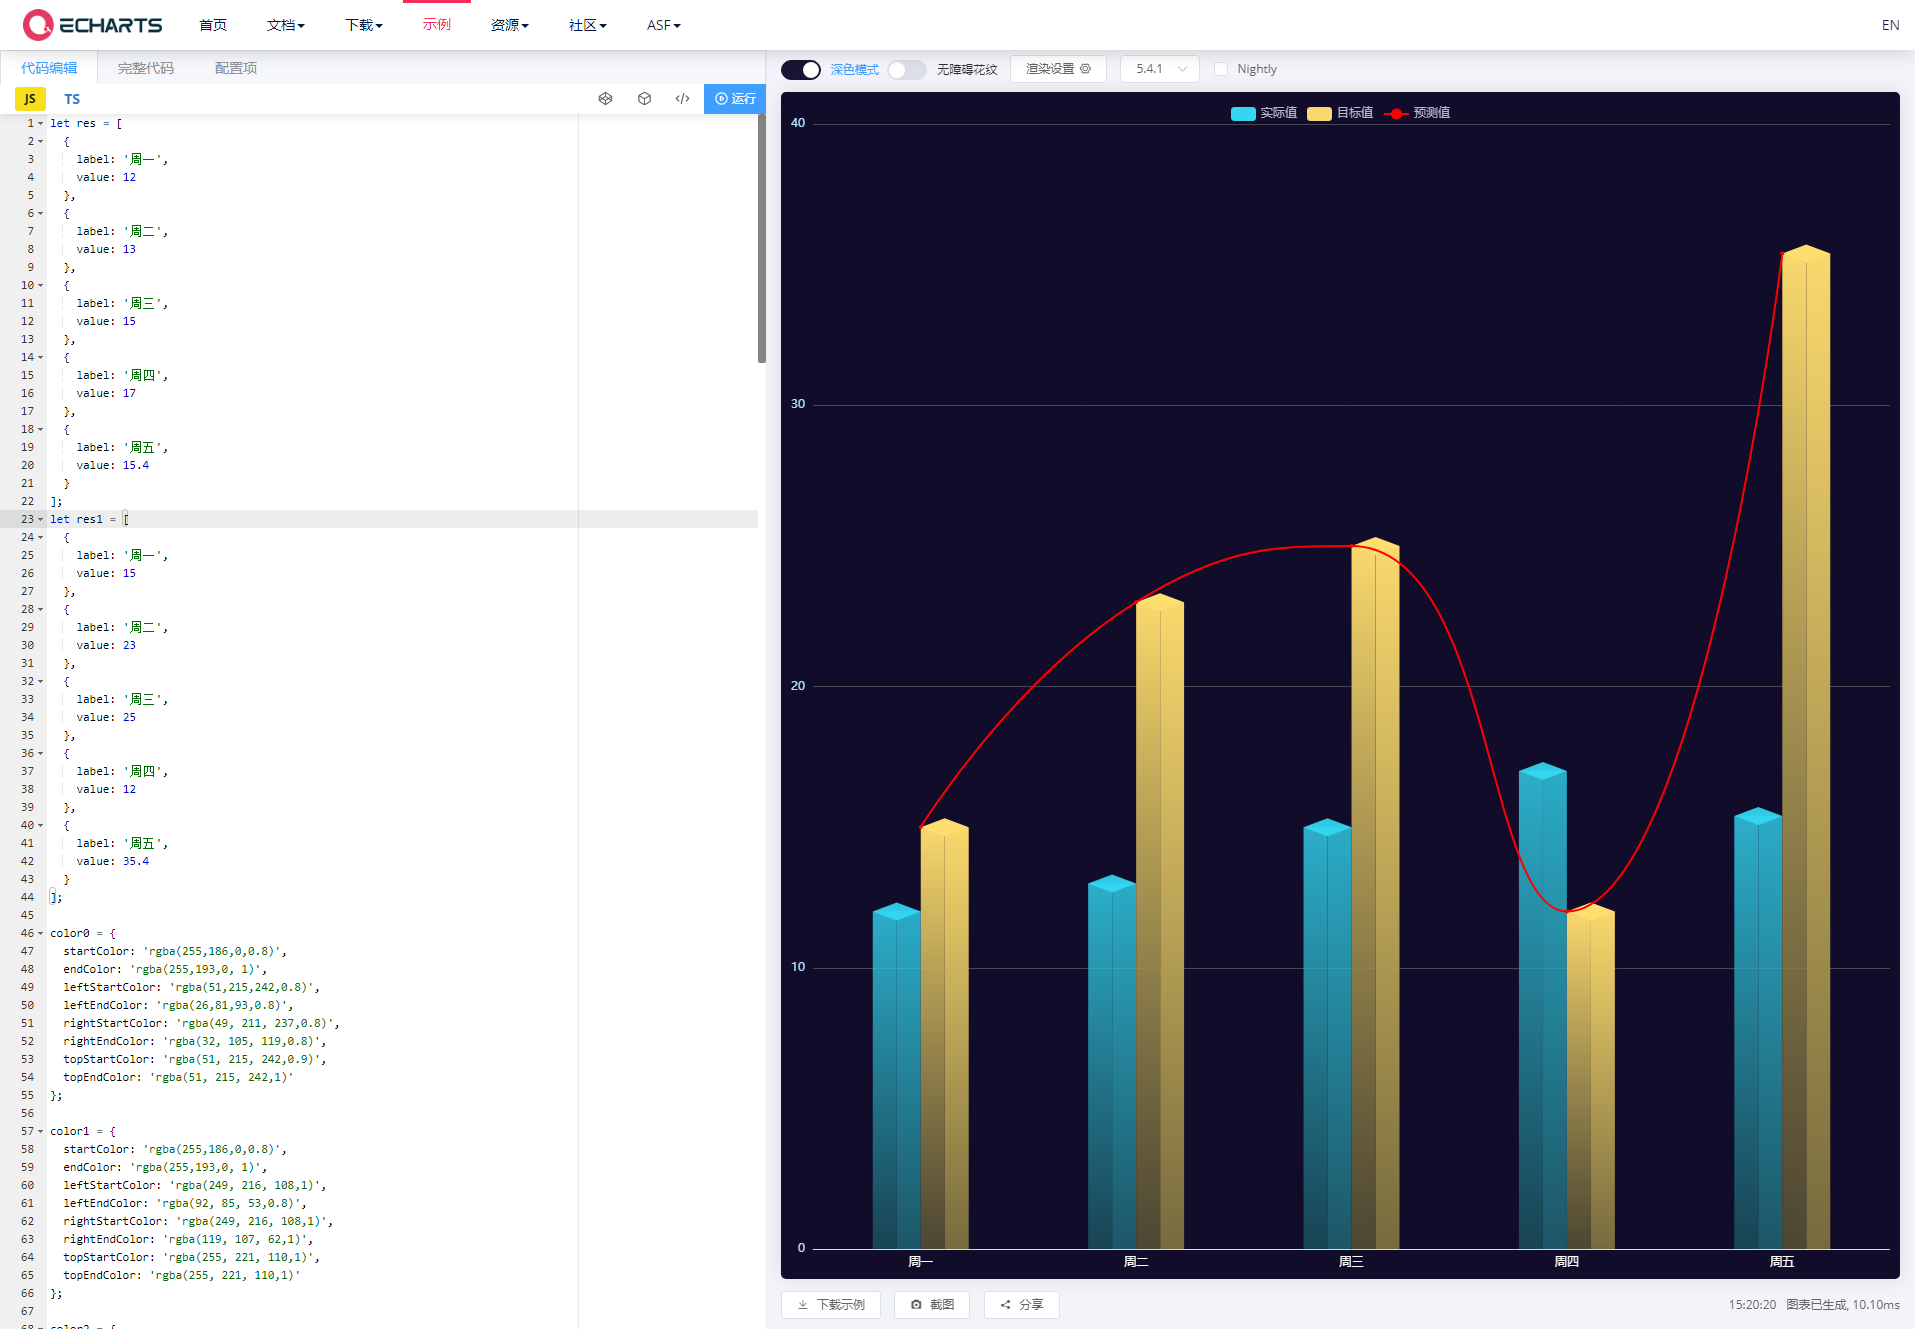
2023-03-09

let res = [
  {
    label: '周一',
    value: 12
  },
  {
    label: '周二',
    value: 13
  },
  {
    label: '周三',
    value: 15
  },
  {
    label: '周四',
    value: 17
  },
  {
    label: '周五',
    value: 15.4
  }
];
let res1 = [
  {
    label: '周一',
    value: 15
  },
  {
    label: '周二',
    value: 23
  },
  {
    label: '周三',
    value: 25
  },
  {
    label: '周四',
    value: 12
  },
  {
    label: '周五',
    value: 35.4
  }
];

color0 = {
  startColor: 'rgba(255,186,0,0.8)',
  endColor: 'rgba(255,193,0, 1)',
  leftStartColor: 'rgba(51,215,242,0.8)',
  leftEndColor: 'rgba(26,81,93,0.8)',
  rightStartColor: 'rgba(49, 211, 237,0.8)',
  rightEndColor: 'rgba(32, 105, 119,0.8)',
  topStartColor: 'rgba(51, 215, 242,0.9)',
  topEndColor: 'rgba(51, 215, 242,1)'
};

color1 = {
  startColor: 'rgba(255,186,0,0.8)',
  endColor: 'rgba(255,193,0, 1)',
  leftStartColor: 'rgba(249, 216, 108,1)',
  leftEndColor: 'rgba(92, 85, 53,0.8)',
  rightStartColor: 'rgba(249, 216, 108,1)',
  rightEndColor: 'rgba(119, 107, 62,1)',
  topStartColor: 'rgba(255, 221, 110,1)',
  topEndColor: 'rgba(255, 221, 110,1)'
};

color2 = {
  startColor: 'rgba(255,186,0,0.8)',
  endColor: 'rgba(255,193,0, 1)',
  leftStartColor: 'rgba(249, 216, 108,1)',
  leftEndColor: 'rgba(92, 85, 53,0.8)',
  rightStartColor: 'rgba(249, 216, 108,1)',
  rightEndColor: 'rgba(119, 107, 62,1)',
  topStartColor: 'rgba(255, 221, 110,1)',
  topEndColor: 'rgba(255, 221, 110,1)'
};

let realPosition = [-24, -9];
let targetPosition = [24, -9];
this.data = res.map((item, index) => {
  return {
    value: item.value,
    label: item.label,
    startColor: color0.startColor,
    endColor: color0.endColor,
    leftStartColor: color0.leftStartColor,
    leftEndColor: color0.leftEndColor,
    rightStartColor: color0.rightStartColor,
    rightEndColor: color0.rightEndColor,
    topStartColor: color0.topStartColor,
    topEndColor: color0.topEndColor
  };
});

this.data1 = res1.map((item, index) => {
  return {
    value: item.value,
    label: item.label,
    startColor: color1.startColor,
    endColor: color1.endColor,
    leftStartColor: color1.leftStartColor,
    leftEndColor: color1.leftEndColor,
    rightStartColor: color1.rightStartColor,
    rightEndColor: color1.rightEndColor,
    topStartColor: color1.topStartColor,
    topEndColor: color1.topEndColor
  };
});
option = {
  color: ['rgb(51,215,242)', 'rgba(249, 216, 108,1)', '#f00'],
  tooltip: {
    trigger: 'axis',
    formatter: (tipArr) => {
      let arr = tipArr.map((item) => {
        return {
          type: item.seriesName,
          value: item.value,
          marker: item.marker
        };
      });

      let map = new Map();
      for (let item of arr) {
        map.set(item.type, item);
      }
      let str = '';
      [...map.values()].forEach((i) => {
        str += `${i.marker}${i.type}:${i.value} <br/>`;
      });
      return str;
    }
  },
  legend: {
    data: ['实际值', '目标值', '预测值'],
    selectedMode: true
  },
  xAxis: {
    type: 'category',
    data: this.data.map((i) => i.label),
    // x坐标轴为虚线
    axisLine: {
      lineStyle: {
        color: '#fff',
        opacity: 0.8
      }
    },
    // 不展示下面|
    axisTick: {
      show: false
    },
    axisLabel: {
      show: true,
      color: '#ffffff',
      fontSize: 12 // 字体大小
    }
  },
  yAxis: {
    type: 'value',
    // 不展示刻度线
    splitLine: {
      show: true
    },
    axisLabel: {
      show: true,
      color: '#B0E1FF',
      fontSize: 12 // 字体大小
    }
  },
  // 栅格
  grid: {
    left: '0',
    right: '0',
    bottom: '0%',
    top: '22px',
    containLabel: true
  },
  series: [
    // 数据的柱状图
    {
      name: '实际值',
      type: 'bar',
      barWidth: 24, // 柱条的宽度,不设时自适应。
      data: this.data,
      itemStyle: {
        color: (params) => {
          return new echarts.graphic.LinearGradient(0, 0, 0, 1, [
            { offset: 0, color: params.data.leftStartColor },
            { offset: 1, color: params.data.leftEndColor }
          ]);
        }
      }
    },
    {
      name: '实际值',
      type: 'bar',
      barWidth: 24, // 柱条的宽度,不设时自适应。
      barGap: 0, // 不同系列的柱间距离
      data: this.data,
      itemStyle: {
        normal: {
          color: (params) => {
            return new echarts.graphic.LinearGradient(0, 0, 0, 1, [
              { offset: 0, color: params.data.rightStartColor },
              { offset: 1, color: params.data.rightEndColor }
            ]);
          },
          borderWidth: 0.1,
          borderColor: 'transparent'
        }
      }
    },
    // 数据顶部的样式
    {
      name: '实际值',
      type: 'pictorialBar',
      symbol: 'diamond',
      symbolSize: [48, 18],
      symbolOffset: realPosition, // [0, -9]
      symbolPosition: 'end',
      z: 3,
      itemStyle: {
        normal: {
          color: (params) => {
            return new echarts.graphic.LinearGradient(0, 0, 0, 1, [
              { offset: 0, color: params.data.topStartColor },
              { offset: 1, color: params.data.topEndColor }
            ]);
          }
        }
      },
      data: this.data
    },
    // 新的一条数据
    {
      name: '目标值',
      type: 'bar',
      barWidth: 24, // 柱条的宽度,不设时自适应。
      data: this.data1,
      barGap: 0,
      itemStyle: {
        color: (params) => {
          return new echarts.graphic.LinearGradient(0, 0, 0, 1, [
            { offset: 0, color: params.data.leftStartColor },
            { offset: 1, color: params.data.leftEndColor }
          ]);
        }
      }
    },
    {
      name: '目标值',
      type: 'bar',
      barWidth: 24, // 柱条的宽度,不设时自适应。
      barGap: 0, // 不同系列的柱间距离
      data: this.data1,
      itemStyle: {
        normal: {
          color: (params) => {
            return new echarts.graphic.LinearGradient(0, 0, 0, 1, [
              { offset: 0, color: params.data.rightStartColor },
              { offset: 1, color: params.data.rightEndColor }
            ]);
          },
          borderWidth: 0.1,
          borderColor: 'transparent'
        }
      }
    },
    // 数据顶部的样式
    {
      name: '目标值',
      type: 'pictorialBar',
      symbol: 'diamond',
      symbolSize: [48, 18],
      symbolOffset: targetPosition, // [0,-9]
      symbolPosition: 'end',
      z: 3,
      itemStyle: {
        normal: {
          color: (params) => {
            return new echarts.graphic.LinearGradient(0, 0, 0, 1, [
              { offset: 0, color: params.data.topStartColor },
              { offset: 1, color: params.data.topEndColor }
            ]);
          }
        }
      },
      data: this.data1
    },
    {
      name: '预测值',
      smooth: true,
      type: 'line',
      data: this.data1,
      itemStyle: {
        normal: {
          color: '#ff0000',
          borderWidth: 0.1,
          borderColor: 'transparent'
        }
      }
    }
  ]
};

myChart.off('legendselectchanged').on('legendselectchanged', function (params) {
  var option = this.getOption();

  if (params.selected.实际值 === true && params.selected.目标值 === false) {
    targetPosition = [24, -9];
    realPosition = [-0, -9];
  }

  if (params.selected.实际值 === false && params.selected.目标值 === true) {
    targetPosition = [0, -9];
    realPosition = [-24, -9];
  }

  if (params.selected.实际值 === true && params.selected.目标值 === true) {
    targetPosition = [24, -9];
    realPosition = [-24, -9];
  }

  option.series[4].symbolOffset = realPosition;
  option.series[5].symbolOffset = targetPosition;

  myChart.setOption(option, true);
  // do something
});


评论区