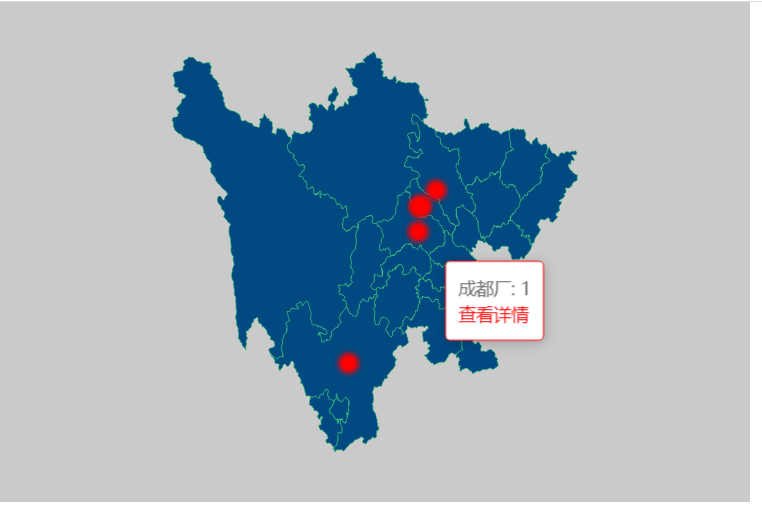
<template>
    <div id="mychart" style="width: 400px;height: 400px;"></div>
</template>

<script>
import chn from "@/assets/china.json"
import * as echarts from 'echarts';

export default {
    mounted() {
        this.$nextTick(() => {
            this.mychart = echarts.init(document.getElementById("mychart"));
            echarts.registerMap("china1", chn);


            var markPointData = [{
                name: "成都厂",
                coord: [104.137443, 30.599544],
            }, {
                name: "什邡厂",
                coord: [104.17825, 31.127038],
            },
            {
                name: "西昌厂",
                coord: [102.222049, 27.879538],
            },
            {
                name: "绵阳厂",
                coord: [104.636895, 31.455209],
            },
            {
                name: "长城雪茄厂",
                coord: [104.208158, 31.114843],
            }];
            var option = {
                backgroundColor: '#cacaca',
                tooltip: {
                    alwaysShowContent: true,
                    enterable: true,
                    formatter: function (params) {
                        var value = params.value;
                        var a = '<br> <a href="http://www.baidu.com" style="color: red">查看详情</a>'
                        return params.name + ': ' + value[2] + a;
                    }
                },
                geo: {
                    map: 'china1',
                    // zoom: 2.2,
                    silent: true,
                    itemStyle: {
                        color: '#004981',
                        borderColor: 'rgb(54,192,118)'
                    }
                },
                series: [
                    {
                        type: 'effectScatter',
                        coordinateSystem: 'geo',
                        itemStyle: {                   // 配置每个数据点的样式
                            color: function (params) {
                                var color = '';
                                var value = params.value;
                                if (value[2] < 50) {
                                    color = 'green'
                                }
                                if (value[2] >= 50 && value[2] < 100) {
                                    color = 'yellow'
                                }
                                if (value[2] >= 100) {
                                    color = 'red'
                                }
                                return 'red';
                            }
                        },
                        data: markPointData.map(e => {
                            return {
                                name: e.name,
                                value: [...e.coord, 1]
                            }
                        })
                    }
                ]
            }
            this.mychart.on("click", function (params) { //单击
                console.log(params);
            });
            this.mychart.setOption(option);
        })
    }
}
</script>

<!-- Add "scoped" attribute to limit CSS to this component only -->
<style scoped></style>


评论区